Understanding sea-level rise - improving predictions through studying the shape of the seabed
Published: 07/06/2024 - 15:33In many places around the world, data clearly shows the level of the sea is rising. In low lying coastal areas, even small increases when coupled with high tides and storm surges have had devastating consequences, such as altering coastlines, impacting offshore energy infrastructure and displacing populations. A better understanding of factors influencing sea level is vital in order to prepare for and mitigate its impacts.
While it is estimated that the single largest contributor to sea-level rise in recent decades has been the melting of the Greenland Ice Sheet, there is much we still do not know about the processes involved. In recent years, Petermann glacier in Greenland lost nearly 40% of its floating ice tongue, with experts deducing warmer subsurface waters from the Atlantic which were able to penetrate into the fjord probably responsible for this major loss of ice. However, just a few kilometres away, Ryder Glacier had been stable for decades.
With the melting of marine glaciers draining into the ocean constituting one of the largest uncertainties in current projections of future global mean sea-level rise, a team of ocean mappers decided to look deeper into what processes could be influencing the formation and melting of glaciers.
They discovered a surprising connection between the shape of the seabed and the size of glaciers.
Watch this video created by the IHO Secretariat in partnership with Martin Jakobsson of Stockholm University and Larry Mayer of the University of New Hampshire to learn more about how better bathymetric data can help improve sea-level rise predictions.
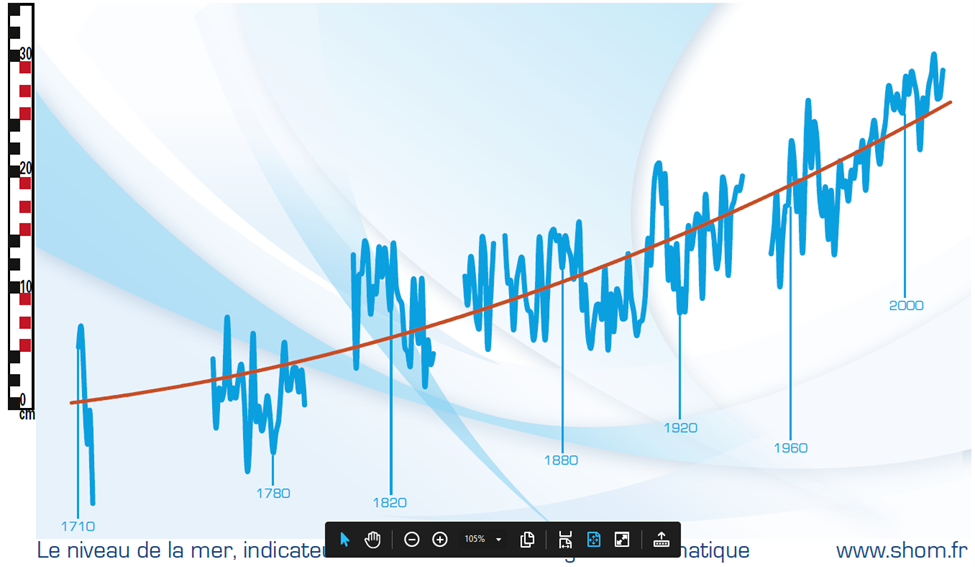
Global data consistently shows that sea levels are rising, albeit at different rates in different regions. Notably, the French Hydrographic and Oceanographic Service (Shom) has been recording sea levels in Brest, on the Atlantic coast, for the past 300 years. Their measurements indicate a slow but steady increase in sea level.
Findings from the recent expeditions to Greenland highlight the critical need for improved ocean mapping to enhance our understanding of the world's marine environments. These discoveries underscore the importance of bathymetry in studying sea level changes. It is already well established that the shape and texture of the seabed significantly influence tide and wave heights, which can vary depending on underwater topography.
The role of hydrography and bathymetry
The uses of hydrographic information have expanded from just nautical charts and services to including a broad range of stakeholders. In terms of sea level, hydrography can provide a range of technological and data solutions which can be used to monitor changes, pinpoint vulnerable areas and prepare for future scenarios. Plus standards for digital data developed by the IHO can facilitate interoperable and machine-readable data sets, thus helping tackle the large quantities of ocean data generated.


Share this page: